In previous articles we have seen different testing procedures that we can use to ensure the quality and correctness of the final product to be delivered. In this article we will talk about SonarQube, a tool that we can also use to ensure our internal quality.
So we can check whether the development process, the architecture used or the algorithms employed follow a suitable structure, a pattern that allows us to maintain the product easily.
What is SonarQube?
SonarQube is one of the most used tools to check codes, detect bugs, vulnerabilities and other problems in our project. It allows the analysis of a code written in the most common programming languages (Java, PHP, JavaScript, C#, HTML, etc.).
SonarQube is integrated as another file in the project to be analysed, and if the pipeline in which the tasks are started is configured correctly, the code inspection is performed automaticallyevery time we make a change in any part of the project.
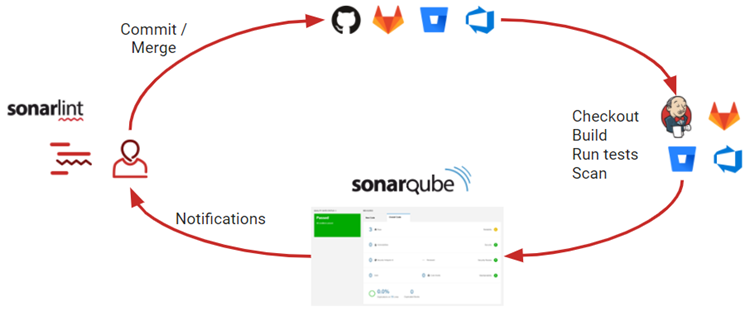
As you can see in the image, the typical scenario in which utility can best be understood is one with three clear phases:
- Development – The code is updated by the developers in the repository. Before they ask the SonarQube service to analyse the changes, they can get immediate feedback thanks to the SonarLint tool, which can be integrated into the IDEs.
- CI/CD – When the new changes are added to the repository, the Continuous Integration tools check and build the code and run the tests. Then the SonarQube scanner is launched to analyse the results of some of these tests and the code as such.
- SonarQube platform – Once the analysis of the project is completed, the results are stored in the platform and depending on the configured quality conditions, team members can be informed if they need to fix a defect.
For the various projects carried out at WATA Factory, we have opted for the Community-Edition, which is free and open source. However, there are also paid alternatives that facilitate the installation and maintenance of the SonarQube service by the same company. The community version can be installed in two ways:
- Local – The developer can set up the SonarQube service on their localhost to be able to analyse their code without having to host it on an external or remote server.
- Remote – The SonarQube service is hosted on a remote server that can be accessed using credentials generated by the service administrator.
Depending on the needs and size of the project (members, resources or services to be used), one can choose the most appropriate option.
General concepts
To understand a little more about the relevance of using this tool, we will detail the general concepts that appear on the platform:
- Users and groups: As in any environment, we can define users that are managed in groups. Each of these users has a set of permissions that allow them to request the analysis of a project, validate false positives of the analysis performed or even cancel it.
- Projects: To carry out the analysis of our code, we need to create a project on the platform with the necessary parameters that identify our software project. hese parameters should be specified in one way or another, depending on the language we use in our project. Within these projects we find the analysis of each project, which contains the following data:
- Bugs: errors in the code that need to be fixed ASAP.
- Vulnerabilities: Places in the code that are open to external attack and can threaten the integrity and security of the project.
- Hotspots: Parts of the code that should be checked to avoid major problems, they do not necessarily compromise the security of the project.
- Code smells: elements that make the code poorly readabla or difficult to maintain.
- Coverage: From the reports of the executed unit tests, SonarQube imports the results and displays the coverage.
- Duplicates: number of detected duplicated blocks, files and rows.
- Total lines: Total number of lines of code in the project.
- Languages: programming languages used in the project.
- Current status: Failed/Passed, depending on the values set in the associated quality profile.
- Tags: tags that have been assigned to the project.
- Time of last analysis: record of each analysis performed.
- Quality profiles: They depend directly on the conditions defined in the Quality Gates, which indicate the rules to be followed in each of the languages available in SonarQube. The conditions of the quality profiles reflect the limits of the minimum coverage, duplicated lines, safety index or maintainability index.
As we can see, the report and the information generated are very comprehensive, giving us a very accurate overview of the status of our project.
At WATA Factory, we have established SonarQube, another tool that enables code quality improvement and also indirect learning among developers. Because with each of the reports, one learns which bad practices to avoid and how to solve themwith the suggestions offered by the same tool, thanks to the rules defined in the Quality Gates. In future articles we will see how we configure our project to be able to analyse it automatically from a pipeline with SonarQube.